Photo: James Bombales
Just how hot is the city’s east end?
Looking at the Toronto Real Estate Board (TREB) data for the first quarter of the year, there were a number of well-known neighbourhoods in the eastern part of the city where homes spent, on average, two weeks or less on the market. Meanwhile, the Toronto-wide average during the same period was 25 days.
In E02, a TREB district that includes neighbourhoods such as The Beaches, Woodbine Corridor and the East End Danforth, the 135 homes sold in the first quarter spent just 12 days on the market, on average.
E01, which consists of North and South Riverdale, Leslieville, Blake-Jones and Greenwood-Coxwell, followed close behind at an average of 14 days on the market. E03 matched that average for homes sold in Broadview North, East York, Danforth Village, Woodbine-Lumsden and O’Connor Parkview. These districts are largely made up of low-rise housing stock.
In contrast, condo-heavy districts typically saw a higher rate for days on the market. In C02, which consists of The Annex/Yorkville, Wychwood, Casa Loma and Yonge and St. Clair, homes spent an average of 37 days.
C01, which includes the Bay Street Corridor, Niagara/Liberty Village, the Downtown West Waterfront Communities, University, and Trinity Bellwoods, saw homes stay on the market for an average of 31 days.
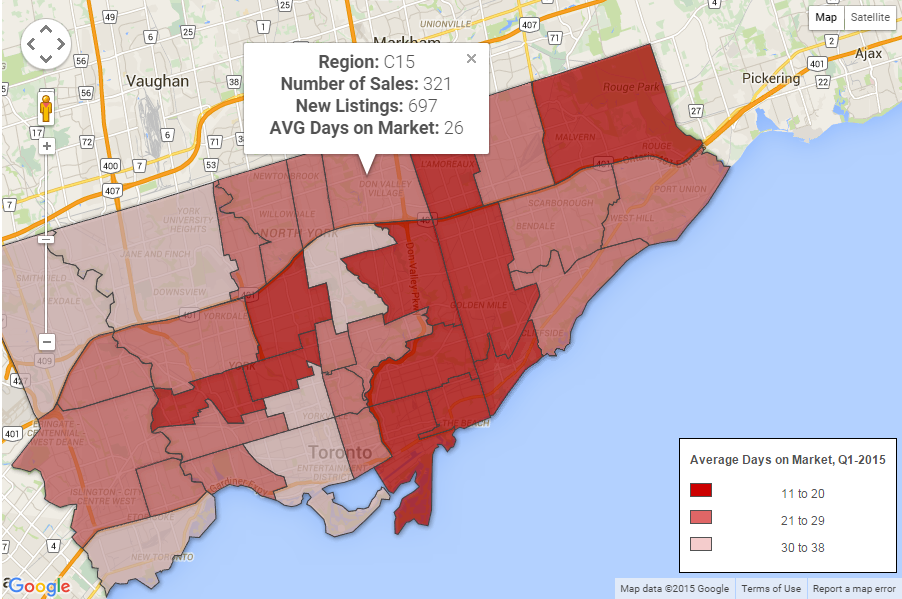
Want to see how your part of the city stacks up? Check out the following color-coded “AVG Days on Market” map based on TREB districts:
Read the full post in BuzzBuzzHome

